
Thermographic Inspection of Solar Panels: Finding Hot Spots Before They Become Failures
A module that looks fine in daylight can be quietly degrading from within. Cracked cells, faulty bypass diodes, resistive solder joints, and blocked ventilation caused by bird nesting all generate localised heat that accelerates material fatigue. Left undetected, a single hot spot can reduce string output by double-digit percentages and, in extreme cases, trigger arc faults. Thermographic inspection of solar panels gives installers a non-contact method to locate these thermal anomalies across an entire array in a fraction of the time a visual walk-over takes.
This guide covers the practical side: what equipment you need, when to schedule a thermal survey, how to interpret the images you capture, and how the findings connect to the maintenance and protection services your crew already delivers.
When to Schedule a Thermographic Inspection of Solar Panels
Thermal imaging is most effective under specific conditions. Understanding when to deploy it determines the quality of the data you collect and the reliability of any follow-up actions.
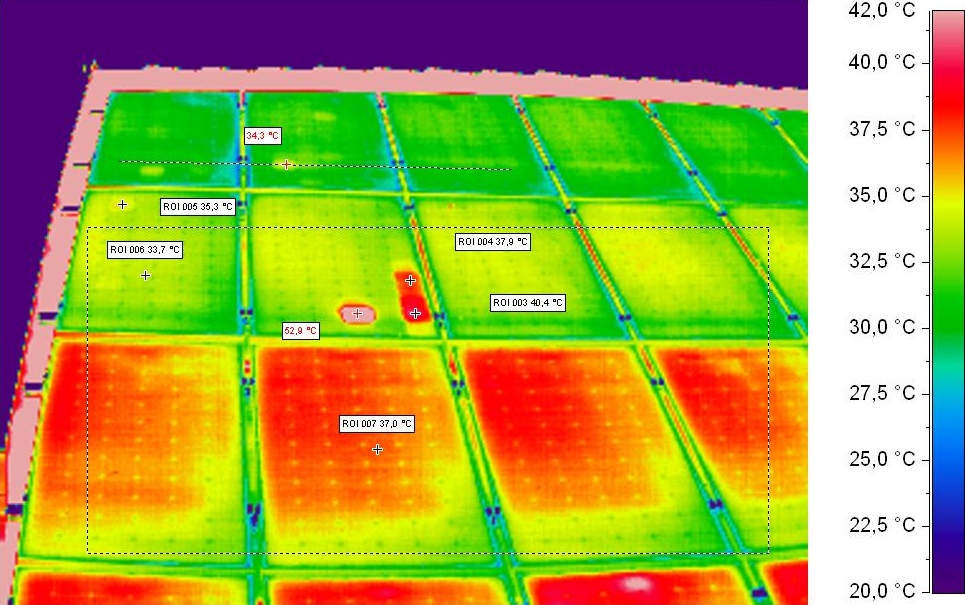
The first rule is irradiance. The array must be generating at or above 500 W/m² at the time of the survey. Below that threshold, temperature differentials between healthy and faulty cells are too small to distinguish from natural variation. In Central Europe, this means scheduling surveys between late morning and early afternoon from April through September.
Practical triggers for a thermographic inspection of solar panels include:
- Commissioning verification — confirming that all modules are producing evenly before handing a system to the client - Annual or biannual maintenance visits — thermal imaging adds objective data to the visual checklist - Unexplained yield drops — when monitoring data flags a string underperformance but visual inspection shows no obvious cause - Post-storm or post-hail assessment — micro-cracks from mechanical impact are invisible to the eye but immediately visible as hot cells - Nesting evidence observed — when bird activity, droppings, or debris beneath modules suggest blocked ventilation channels
According to Fraunhofer ISE research on PV module reliability, early-stage cell degradation detected via thermal imaging can prevent cumulative yield losses that compound over the remaining system lifetime.
Equipment for Effective Thermal Imaging
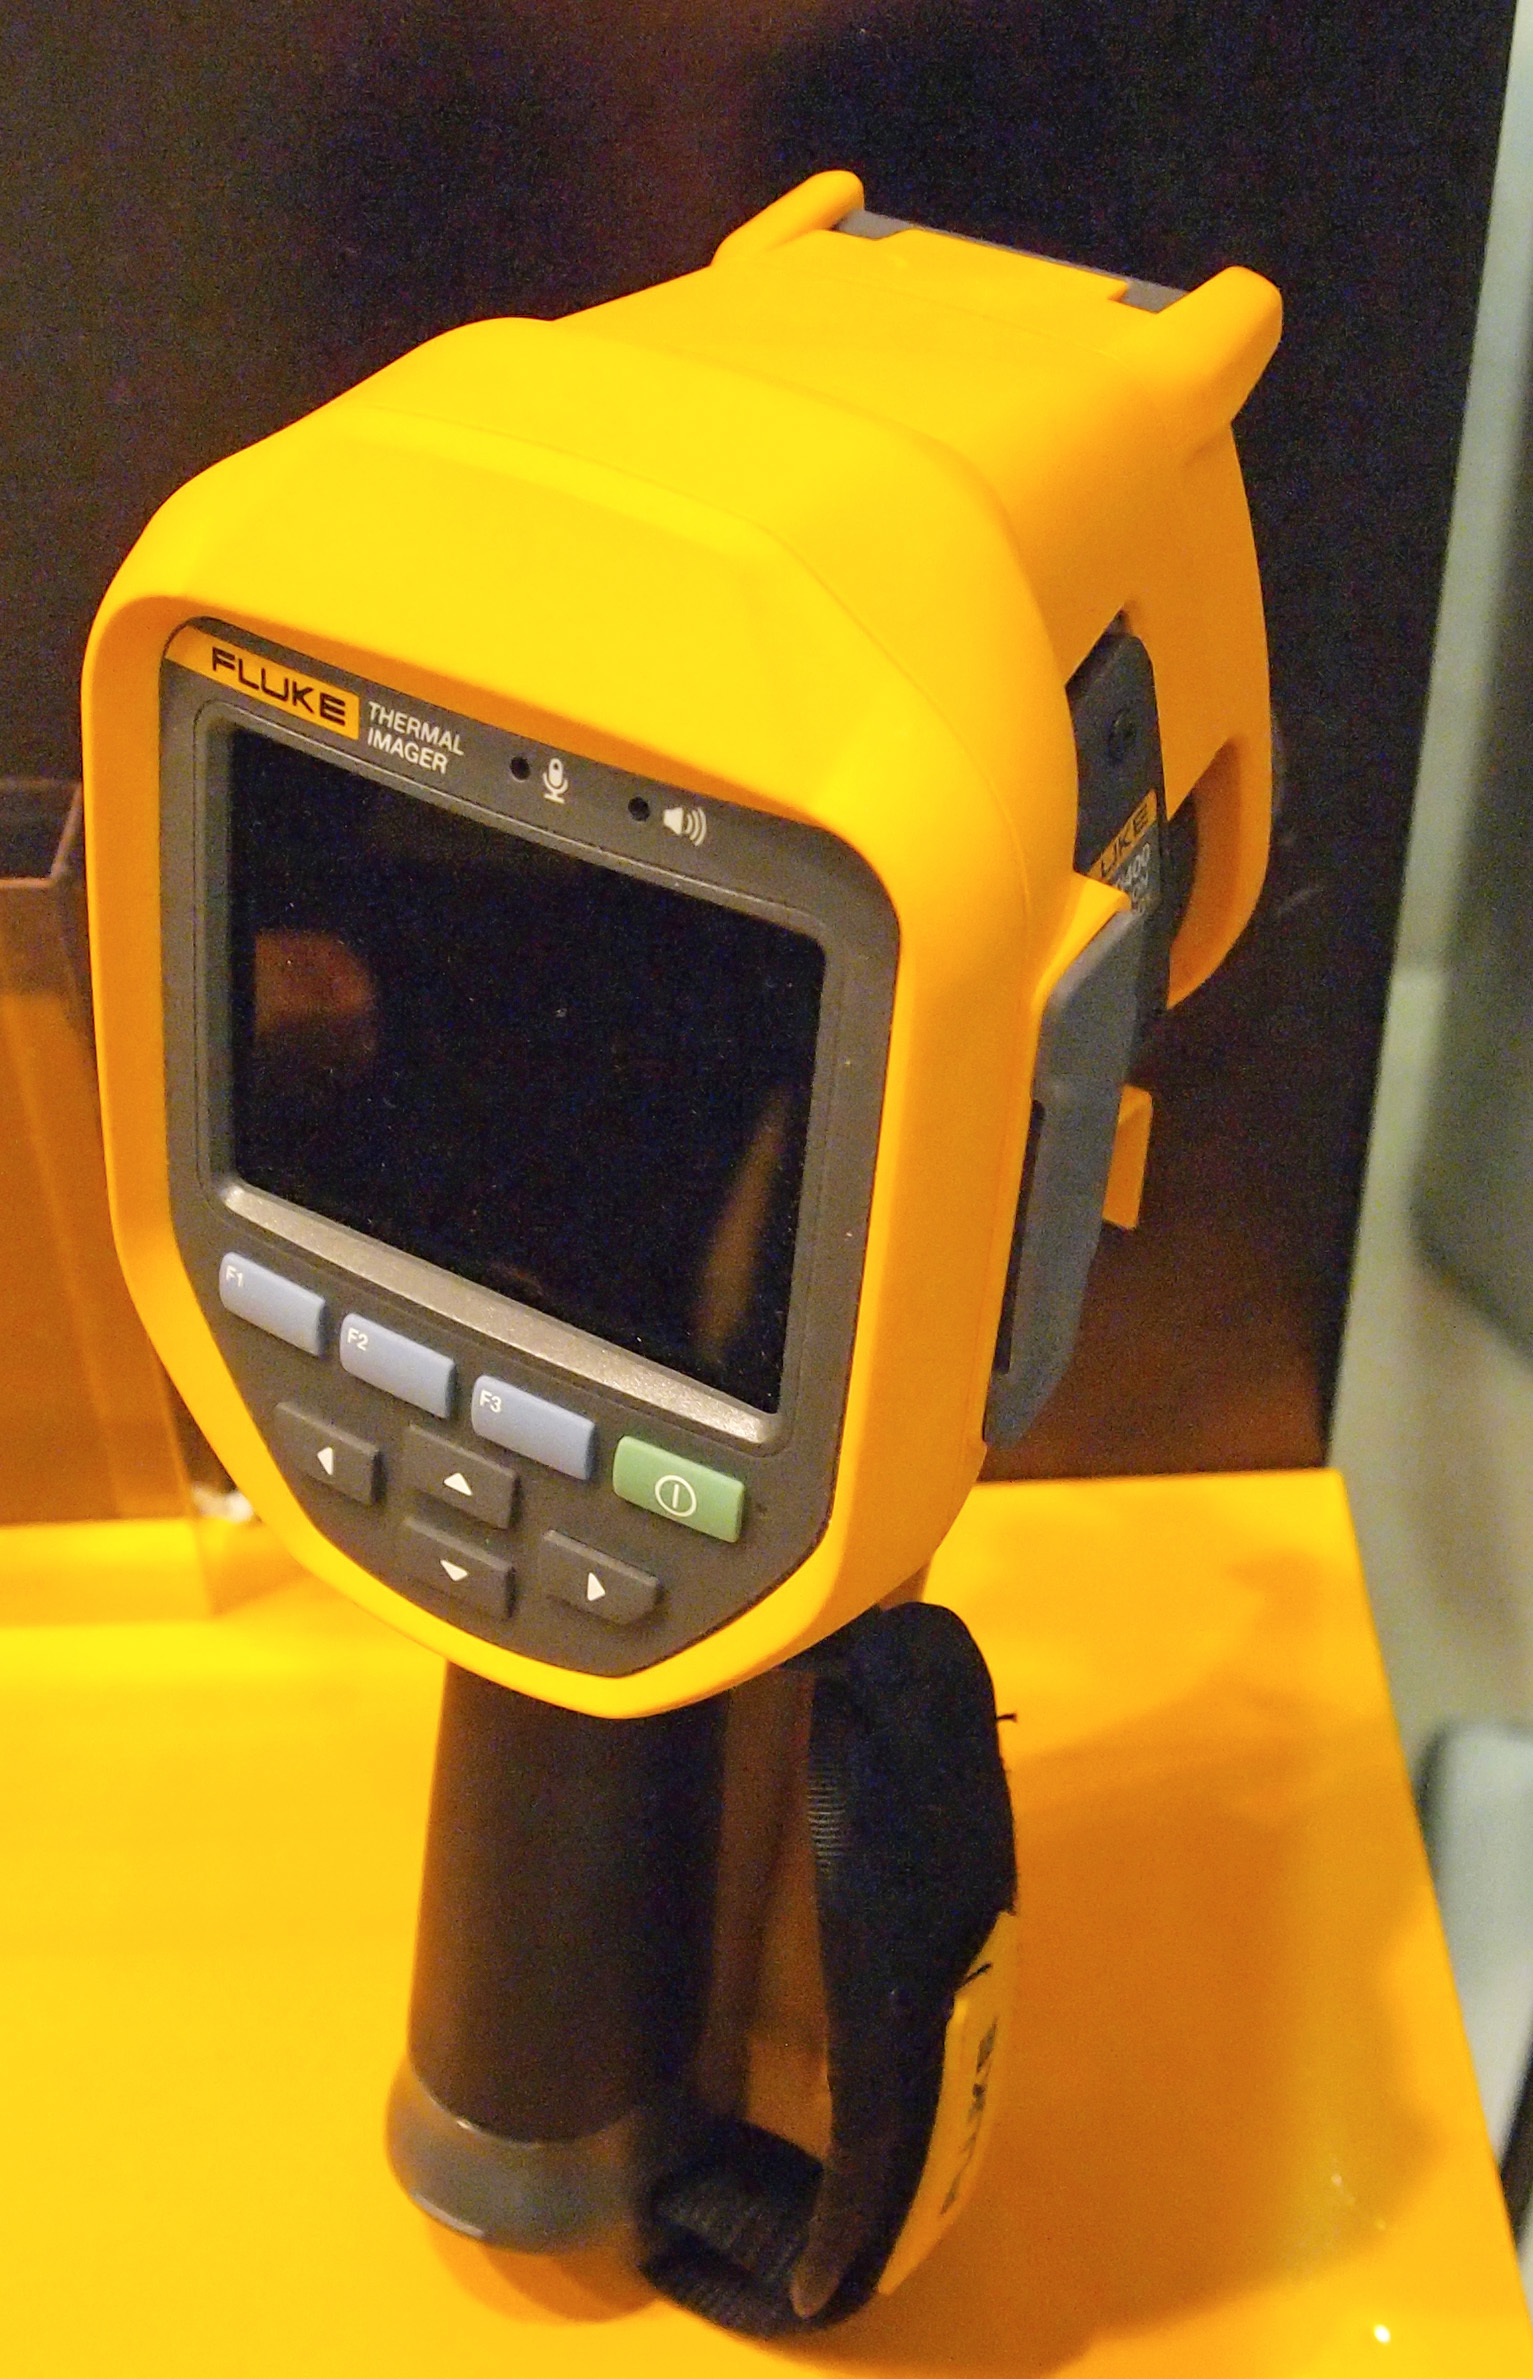
A professional thermographic inspection of solar panels does not require the most expensive camera on the market, but it does require a sensor with sufficient resolution to distinguish individual cells at the working distance of a rooftop survey.
Handheld infrared cameras
Entry-level thermal cameras with a resolution of 160 × 120 pixels are adequate for residential arrays where the surveyor can approach within two metres of the module surface. For commercial rooftops where access is restricted, a minimum of 320 × 240 pixels is recommended. Key specifications to evaluate:
- Thermal sensitivity (NETD) — below 50 mK for detecting early-stage hot spots - Spectral range — 7.5–14 µm covers the emission peak of PV module surfaces - Frame rate — at least 9 Hz for smooth panning across a large array - Field of view — a wider lens reduces the number of images needed per row
Drone-mounted thermal surveys
For arrays above 100 kWp, drone surveys dramatically reduce inspection time. A drone-mounted radiometric camera captures geo-referenced thermal data that can be stitched into a heat map of the entire installation. Flight altitude between 10 and 20 metres provides a good balance between resolution per cell and coverage per flight pass.
The regulatory requirements for commercial drone flights vary by country. In Germany, pilots need an EU Remote Pilot Certificate (A2 category or above). In most EU states, the lightweight category (sub-250 g) is insufficient because radiometric cameras add mass.
How to Interpret Thermal Anomalies
Not every temperature differential indicates a fault. Successful thermographic inspection of solar panels depends on the surveyor's ability to classify what the camera reveals.
Single-cell hot spots
A single cell that is significantly warmer than its neighbours — typically 10–20 °C above the surrounding cells — usually indicates a cracked cell or a high-resistance solder joint. The bypass diode activates to protect the module, but the affected cell continues to dissipate energy as heat. If multiple single-cell hot spots appear across a string, the cumulative effect on string voltage can reduce inverter efficiency.
Substring hot patterns
When an entire third of a module runs warmer than the rest, the bypass diode for that substring has likely failed in a short-circuit state. The diode is no longer bypassing the affected cells — instead, it is conducting permanently. This pattern is distinct from a single-cell fault and requires diode replacement.
Edge heating and ventilation blockage
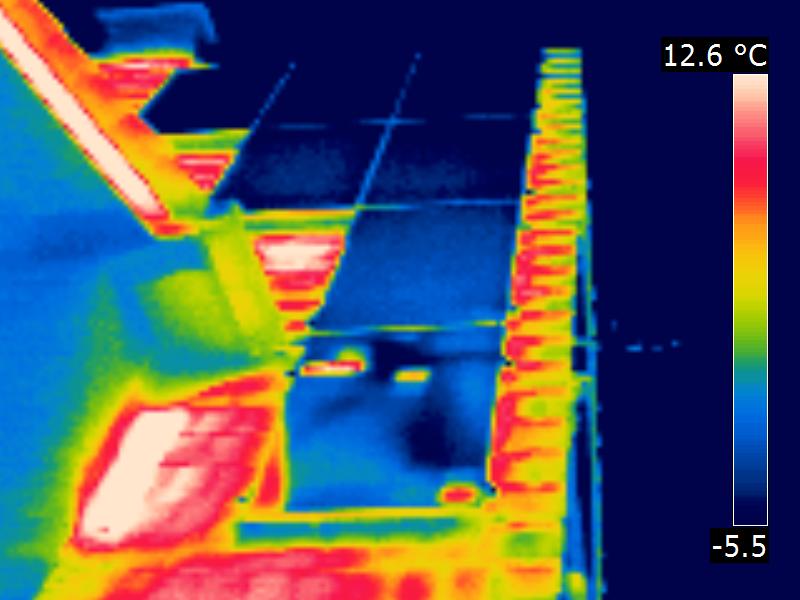
Elevated temperatures along the bottom edge of modules — especially uniform warming across multiple panels in a row — point to restricted airflow beneath the array. The most common cause in pitched-roof installations is accumulated nesting material, feathers, and droppings that form a thermal blanket. Ventilation blockage is harder to detect visually because the material sits behind the module, but it shows clearly on a thermal image as a broad, low-intensity warm band.
This is where thermographic inspection connects directly to bird protection. If edge heating patterns appear consistently across a section of the array, the remediation path involves clearing the nesting material and installing perimeter mesh to prevent recurrence. Without the mesh, the nesting cycle repeats within one season.
Connecting Hot Spots to Bird Damage
Installers who already offer bird protection services should understand the direct relationship between nesting activity and thermal anomalies. The physics is straightforward: bird nests block the convective airflow that keeps modules within their rated operating temperature. Every degree above the rated temperature costs roughly 0.35–0.45 % in module output for crystalline silicon technology.
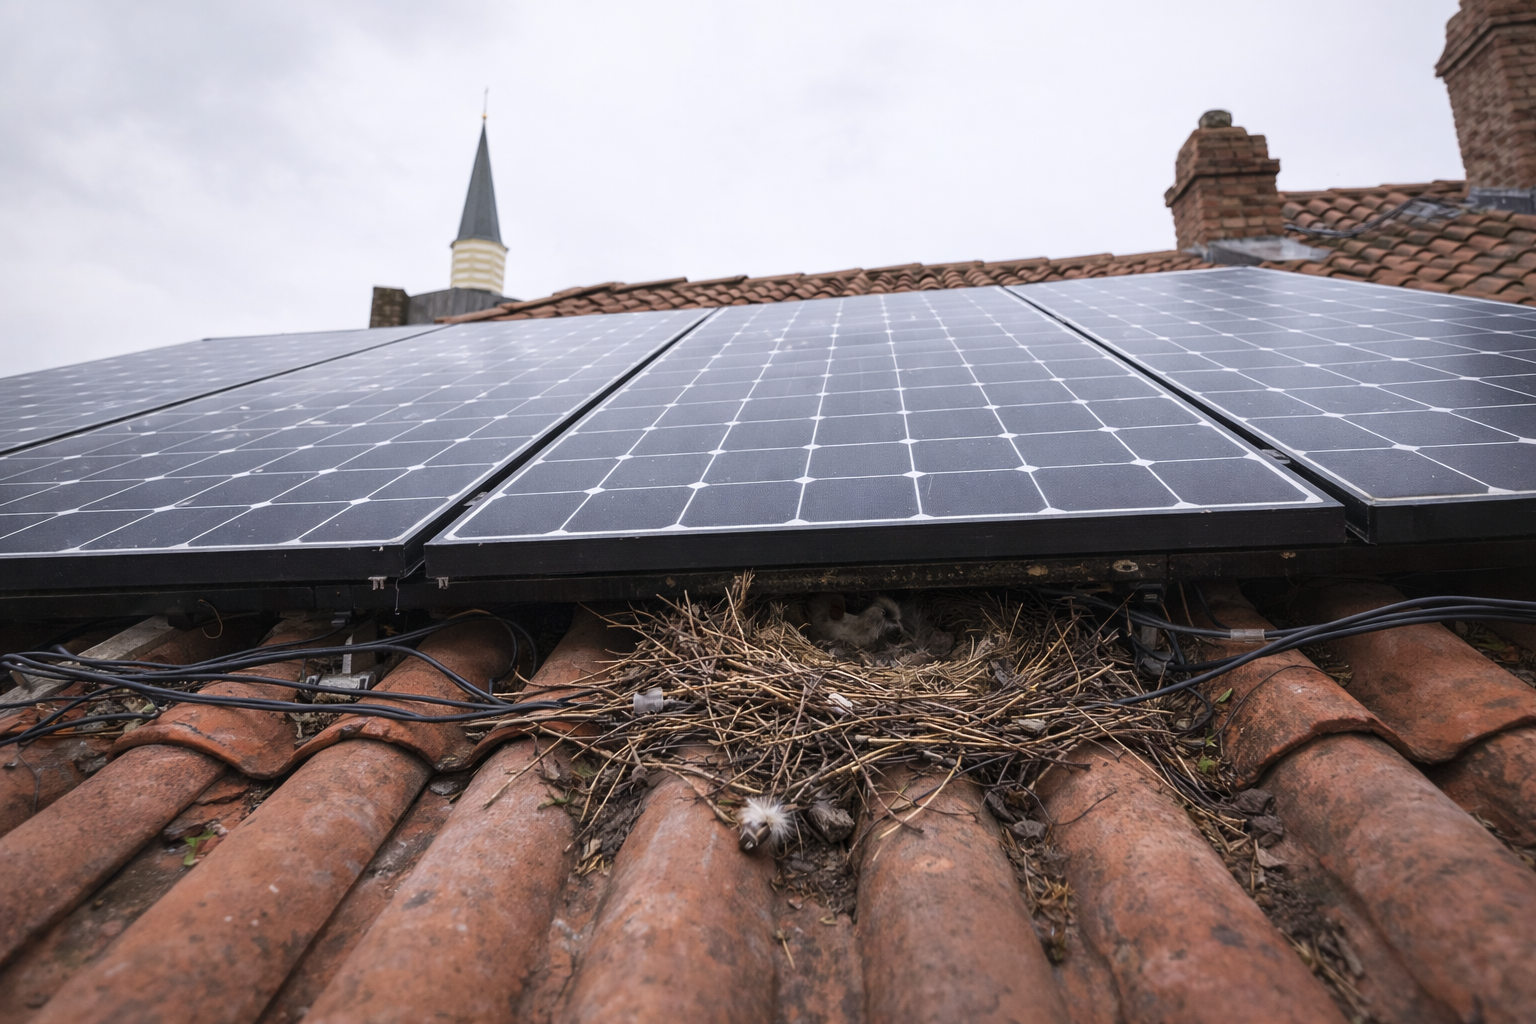
A single nest beneath a row of modules can raise the local operating temperature enough to trigger bypass diode activation, which then appears as a substring anomaly on the thermal image. If the surveyor does not check beneath the modules, the anomaly may be misattributed to an internal module defect, leading to an unnecessary warranty claim instead of a straightforward cleaning and mesh installation.
Practical workflow when thermal imaging reveals edge heating:
1. Document the thermal pattern with geo-referenced images 2. Physically inspect beneath the affected modules for nesting evidence 3. Clear all debris and nesting material 4. Perform a follow-up thermal scan to confirm the anomaly resolves 5. Install perimeter protection to prevent future nesting
This workflow converts a diagnostic service into a protection upsell — the client sees the thermal evidence, understands the cause, and authorises the installation of bird mesh as a preventive measure.
Reporting and Documentation
A thermographic inspection of solar panels produces value only if the findings are documented in a format the system owner or O&M manager can act on. A professional thermal report typically includes:
- Array overview image annotated with module positions and anomaly markers - Detail images of each identified anomaly with temperature delta, GPS coordinates (if drone survey), and classification (cell crack, diode failure, ventilation blockage, junction box overheat) - Severity grading — IEC TS 62446-3 provides a three-tier classification: minor (monitoring recommended), major (service required within the next maintenance cycle), critical (immediate intervention required) - Recommended actions per anomaly, including any protection measures to address root causes like nesting
Documenting the inspection systematically also protects the installer. If a module later fails, the thermal survey record demonstrates that the issue was identified and communicated to the asset owner within a defined timeframe.
Integrating Thermal Surveys into Your Service Offering
For installation businesses looking to build recurring maintenance revenue, thermographic inspection is one of the most effective add-on services. The equipment cost is modest relative to the billable value of each survey, and the skill set overlaps with the electrical knowledge your team already has.
A practical approach:
- Bundle thermal inspections with annual maintenance contracts — the survey runs during the same site visit as visual checks and inverter log reviews - Offer post-installation commissioning thermal scans as standard on new installations — this sets a baseline that makes future anomaly detection faster - Use thermal evidence to justify protection work — a client who sees a hot spot caused by nesting is far more likely to authorise preventive mesh installation than one who receives a verbal recommendation alone
The combination of thermal diagnostics and physical protection creates a service loop: the inspection identifies the problem, the protection prevents its recurrence, and the next annual inspection confirms the solution holds.
Key Takeaways
Thermographic inspection of solar panels is a non-invasive, efficient diagnostic method that reveals faults invisible to the naked eye. For installers who already work on rooftops daily, adding thermal imaging to the toolkit is a natural extension that strengthens maintenance contracts, supports upsell conversations, and protects clients from progressive yield losses.
The connection to bird protection is direct: blocked ventilation from nesting is one of the most common causes of edge-heating anomalies on pitched-roof arrays. Identifying this pattern early — and resolving it with both clearing and perimeter mesh — demonstrates the kind of complete-solution thinking that builds long-term client relationships.
Comments