Bird Droppings on Solar Panels: How to Quantify the Yield Loss
Bird droppings on solar panels are one of those problems everyone can see and almost nobody puts a number on. The array "still works", the inverter shows production, and the deposits at the lower module edge get filed under cosmetics. For an EPC or O&M team answering to an asset owner, that is not good enough: a loss you have not measured is a loss you cannot manage, budget for — or prevent.
This article sets out a practical way to quantify what droppings and dust actually cost a rooftop system, using data you already have. The discussion assumes a pitched-roof photovoltaic array with a defined lower module edge — PV Protector® is engineered for pitched roofs and does not fit flat-roof ballasted systems, ground-mount or open-field PV.
Why Droppings Are Not Ordinary Dust
Dust settles as a thin, fairly uniform film across the whole module surface. It reduces transmitted light by a few percent, and rain washes part of it away. Droppings behave differently: they are opaque, they concentrate where birds perch and nest — along ridge lines, cable entries and the lower module edge — and they do not rinse off with the next shower.
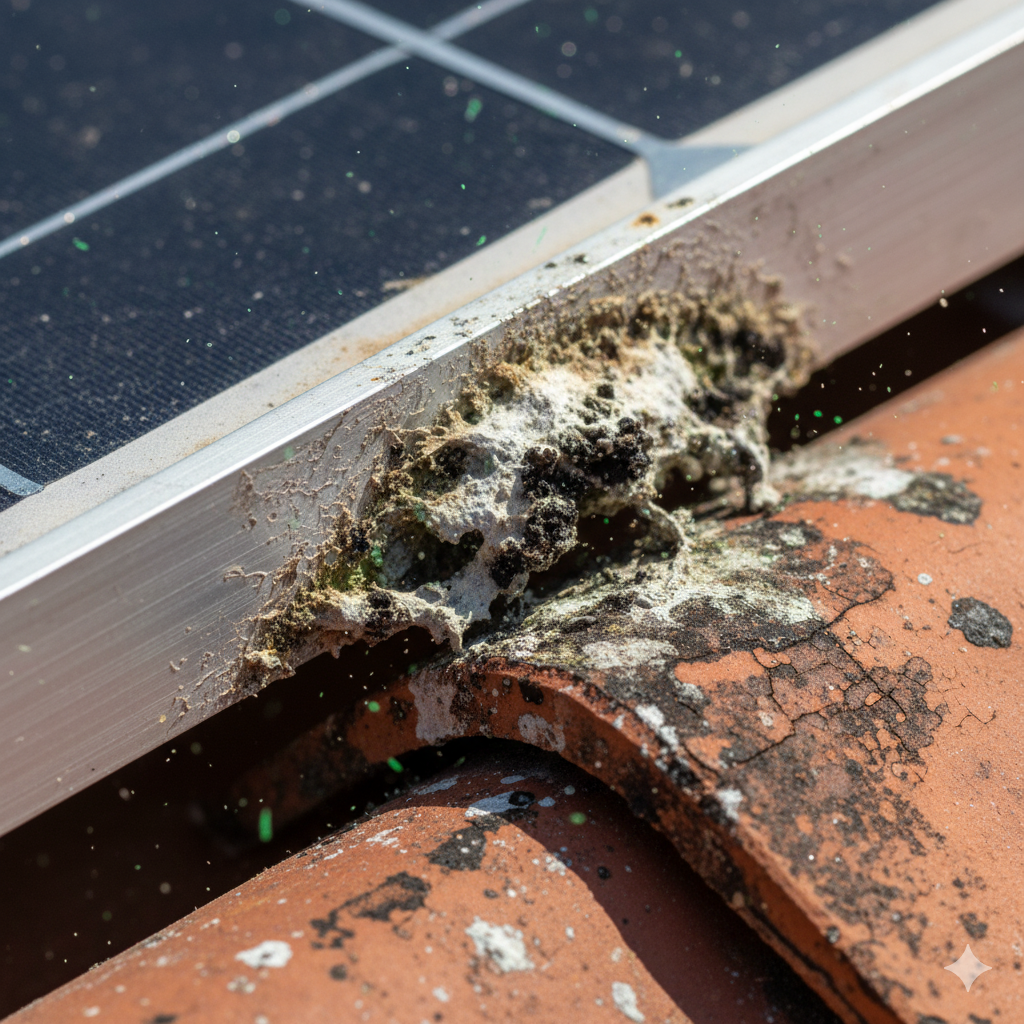
That difference matters electrically. A dense deposit acts as hard shading on individual cells. The affected cell limits current for its whole substring, so a deposit covering a fraction of one cell can pull down a disproportionate share of the module's output, and the shaded cell dissipates energy as heat. Small experimental studies consistently report measurable output reductions and elevated local cell temperatures under dropping deposits; the magnitude depends on coverage area and position on the module. Uniform dust dims the array — concentrated droppings distort it.
What Verified Industry Data Says About Soiling
The most comprehensive public reference is the IEA-PVPS Task 13 report on soiling losses. Its headline findings: after irradiance, soiling is the single most influential factor affecting PV system yield, it is estimated to cut annual PV energy production by 3–5 % globally, and the report links it to substantial additional operating, cleaning and capital expenditure across the industry (IEA-PVPS Task 13, Soiling Losses – Impact on the Performance of Photovoltaic Power Plants).
The same report stresses that soiling is highly heterogeneous — between regions, between plants, and even between modules of the same array. That is exactly what bird activity produces: a handful of heavily fouled modules under a favourite perch, next to rows that are almost clean. Field feedback from Mediterranean O&M teams suggests localized dropping soiling can push affected arrays toward the upper end of that 3–5 % band — but the honest answer for any specific roof comes from its own data, which is why the next section exists.
Quantifying Bird Droppings on Solar Panels: A Four-Step Method
You do not need a soiling station to get a defensible number for a rooftop system. Four steps, using the monitoring portal and a camera:
Step 1 — Establish the clean baseline. Take the specific yield (kWh/kWp) of the array in the weeks immediately after a documented cleaning, and note the season. This is your reference state.
Step 2 — Compare strings against each other. On multi-string systems, plot string or MPPT currents side by side on clear days. Strings under a ridge line or perch zone that run persistently below their electrical twins point to localized soiling — droppings, not dust.
Step 3 — Measure the cleaning delta. The most convincing single number: specific yield in the seven to fourteen days before a cleaning versus the same window after it, on comparable irradiance days. The difference, expressed as a percentage, is what soiling was costing at that moment.
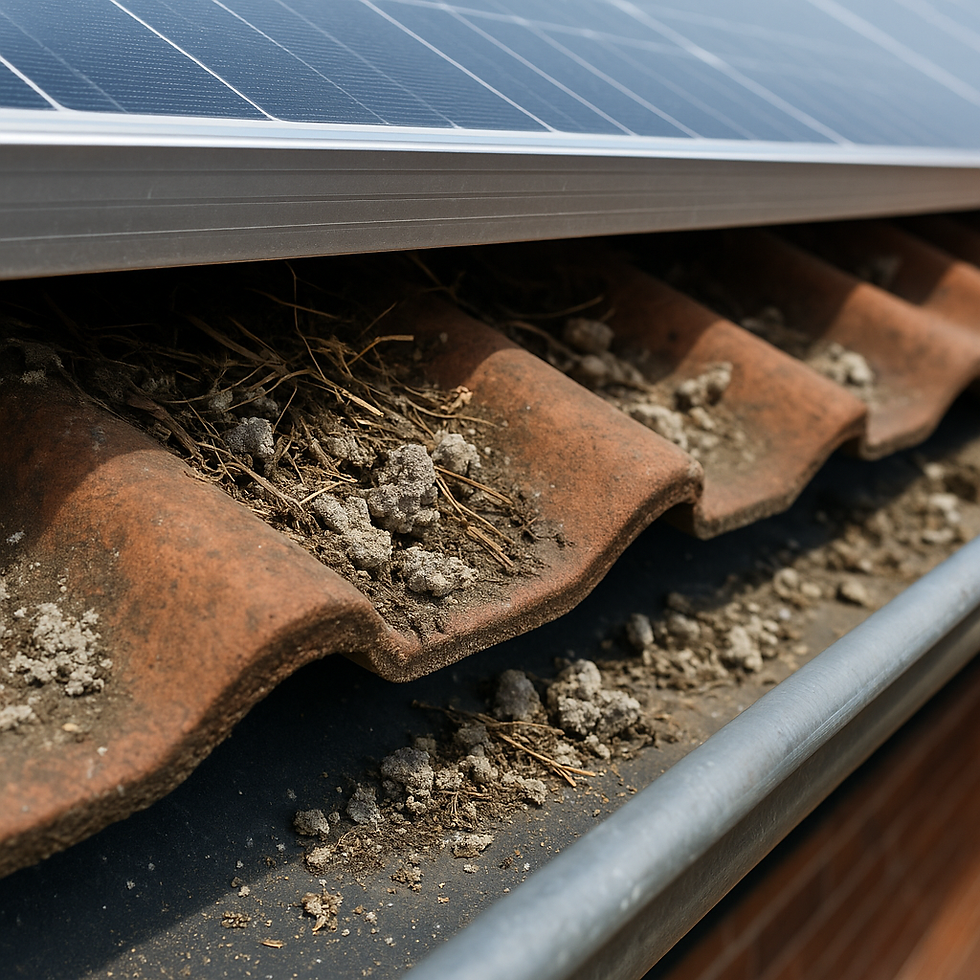
Step 4 — Document the cause. Photograph the deposits before cleaning, with date stamps and module positions. During the next service visit, check the underside of the array — nesting material at the lower module edge means the soiling source lives on the roof, and the loss will return on schedule. Our guide to identifying bird damage during a PV system inspection covers what to look for.
From Kilowatt-Hours to a Business Case
Once you have a percentage, the finance conversation becomes simple. Multiply the measured loss by the array's annual production to get kilowatt-hours; value those at your own feed-in tariff, PPA rate or avoided-consumption price — figures you have on file, and which vary too much between markets and contracts for any generic benchmark to be honest.
Then add the second line: recurring cost. Where droppings come from resident birds, cleaning is not a one-off but a cycle, and every cycle carries access costs — scaffolding, lifts, labour on a pitched roof. The full picture of what repeated visits do to operating budgets is set out in the hidden maintenance costs of bird activity on rooftop PV systems. A yield percentage plus a cleaning cycle, both from your own records, is a business case an asset owner can sign off — no invented industry averages required.
Breaking the Cycle Instead of Measuring It Forever
Measurement tells you what the loss is; only prevention changes it. As long as birds nest under the modules, they perch above them, and the deposits reappear within weeks of every cleaning — which is why cleaning alone never closes the case, as we discuss in how bird protection changes solar panel cleaning.
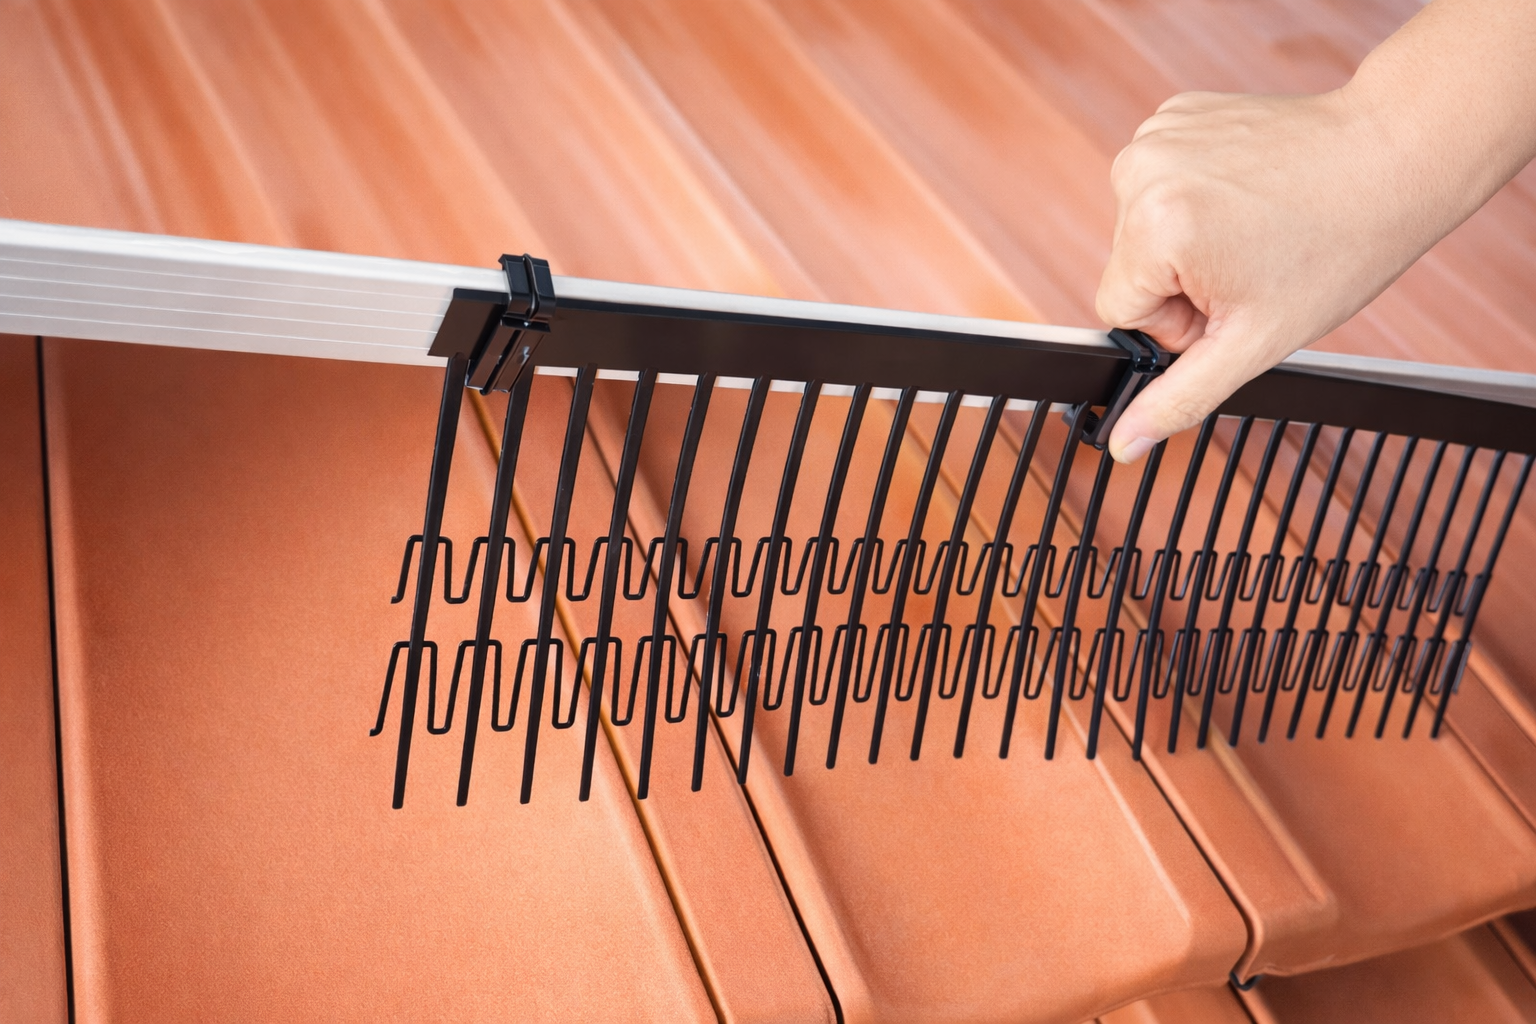
PV Protector® closes the habitat with three engineered components. The Perimeter Segments — HDPE with UV stabilisers 944 and 622 — seal the open edge under the modules and come in two heights, 150 mm (Standard) and 200 mm (Extended). C-Clips of UV-stabilised PC+ABS snap them onto module frames of 30, 35 and 40 mm, tool-free and without drilling, so the module warranty is never touched. UV-stabilised PA66 Cable Ties secure the run. The system carries a 10-year warranty per the manufacturer specification and is designed exclusively for pitched roofs with a defined lower module edge. No habitat means no perch traffic, fewer concentrated deposits, and a cleaning interval driven by dust and pollen instead of by pigeons.
A Measurement Checklist for Your Next Site Visit
Five items turn this article into a routine:
- Pull the specific yield for the last twelve months and mark every cleaning date on the curve. - Compare parallel strings on three clear days; flag any string persistently below its twins. - Photograph deposits before cleaning — date, module position, close-up and context shot. - Record the cleaning delta in kWh/kWp and as a percentage; file it with the invoices. - Inspect the module underside at the eaves edge; if nesting material is present, quote physical prevention alongside the cleaning, not after the next loss.
Bird droppings on solar panels stop being an anecdote the moment they become a percentage on a monitoring chart. Measure the loss once, document the cause honestly — and then remove the mechanism: a pitched-roof array fitted with PV Protector® Perimeter Segments (HDPE, UV stabilisers 944 and 622), C-Clips (UV-stabilised PC+ABS for 30/35/40 mm frames) and PA66 Cable Ties keeps the deposits from coming back, backed by a 10-year warranty.
To specify bird protection for your next pitched-roof project — or to discuss installer and distributor conditions — talk to the PV Protector® team.
Comments